Problems
The problems I get called in for.
Each of these sounds like bad luck or a bad forecast. Each has a structural cause you can see, test and change. Every one links to a working tool that shows it.
Problem 01
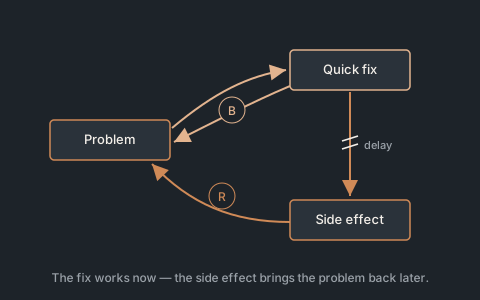
“We fix the same supply problem every year.”
Recurring problems
- What it looks like
- The same shortage, expedite or write-off returns each season. Each time it is blamed on a supplier, a planner or bad luck.
- What is going on
- Recurring problems come from feedback and delays, not bad luck. Orders, stock, staffing and capacity react to each other late. Those late reactions recreate the problem.
- What to do
- Map the loops with the people who run them. Then test changes on a model before trying them on the network.
- See it working
- Supply Pulse shows how quality holds, shelf life, hiring and a distant supplier turn a demand peak into empty shelves and expired stock. Lag Lab splits an overshoot into its causes.
- Where it fits
- Disruption Diagnostic
Problem 02
“Planning keeps calling it forecast error.”
Overshoot after a demand step
- What it looks like
- Demand steps up and production, stock and hiring overshoot. The review blames the forecast and buys a better one.
- What is going on
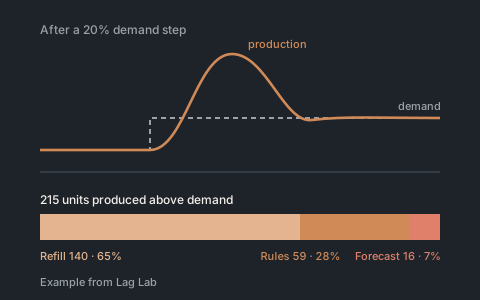
- Overshoot after a demand step is the structure of planning, not the forecast. Part of it is stock and pipeline that must be refilled. Most of the rest comes from the decision rules.
- What to do
- Separate the necessary refill from what the rules add. Then change the rules, which is cheaper than a better forecast.
- See it working
- Lag Lab runs the same step three ways and splits the overshoot exactly. In its example, a perfect forecast removes only 7% of it.
- Where it fits
- Disruption Diagnostic
Problem 03
“We don’t know which disruption would really hurt us.”
Unclear exposure
- What it looks like
- The risk register scores dozens of threats. Nobody can say which closure would stop shipments first, or for how long.
- What is going on
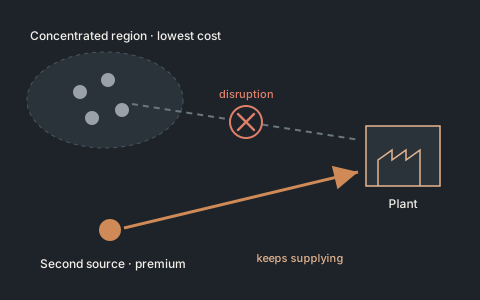
- Exposure is time-to-survive versus time-to-recover, not a risk-register score. A site is exposed when its stock and alternatives run out before the disruption ends.
- What to do
- Screen the main sites and routes on both times. Then price the responses that close the gap.
- See it working
- Global Disruption Atlas replays real disruptions on live chokepoint data and costs the responses. Network Stress Test finds which single site failure costs most, and what insuring against it costs.
- Where it fits
- Disruption Diagnostic · Network Flexibility Study
Problem 04
“We’re committing capital on one forecast.”
Capital on a single forecast
- What it looks like
- A new plant, warehouse or second source is approved on one demand forecast. Flexibility appears only as a note in the margin.
- What is going on
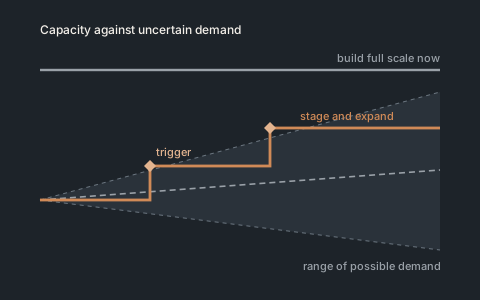
- Flexibility has a price you can calculate. The right to stage, defer, expand or lease has a value that can be set against committing now.
- What to do
- Value each option against the best fixed design. Then set the triggers for the decisions that can wait.
- See it working
- Real Options for Network Design compares committing now, the best fixed design, waiting, staged expansion and leasing on the same uncertain demand.
- Where it fits
- Network Flexibility Study
Problem 05
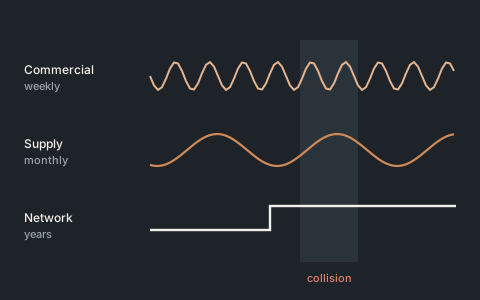
“Commercial, supply and network decisions move at different speeds and collide.”
Decisions at different speeds
- What it looks like
- Commercial promises change in months, the supply chain in a year, the network in years. Each function is right on its own, and the company still misfires.
- What is going on
- Clockspeed mismatch is a design problem, not a coordination problem. Decisions that take effect at different speeds have to be planned together.
- What to do
- Make the three speeds visible in one model. Then pace the fast decisions to what the slow ones can support.
- See it working
- Clockspeed Balancing lets a leadership team fly a company for 20 years and see what each mismatch costs.
- Where it fits
- Disruption Diagnostic
Next step